“An important update is pending” – Edge WebView2

Did you ever start Power BI Desktop and this error showed-up out of nowhere?!

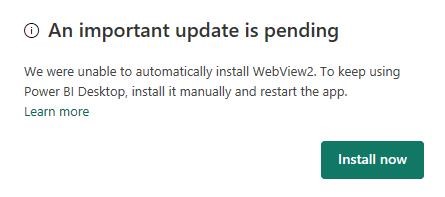
Clicking “Install now” seems to be doing something but in the end it fails saying Microsoft Edge Webview2 Runtime is already installed?

Restarting the machine does not help, don’t bother trying 🙂

Uninstalling and installing Power BI Desktop again – same issue.

Ok, let’s look into WebView2 and what’s wrong here…

According to Event Viewer: Windows is unable to verify the image integrity of the file \Device\HarddiskVolume3\Program Files (x86)\Microsoft\EdgeWebView\Application\111.0.1661.62\prefs_enclave_x64.dll because file hash could not be found on the system. A recent hardware or software change might have installed a file that is signed incorrectly or damaged, or that might be malicious software from an unknown source.

In plain English this means there is an issue with WebView2 and not Power BI. But wait, we already knew that, right? And we already clicked “Install now” and nothing happened, right?

Ok, let’s go to the Apps and uninstall and reinstall WebView2 I thought initially. But wait, the app does not have the uninstall option, only Modify.  

Clicking Modify started a new small window and I could see it downloaded the installer and then started installing it. With no other messages, that small window closed unexpectedly, with no success or failed message… Rolling over my eyes, I opened Power BI Desktop and it started fine this time! 

Power BI Data Profiling – distinct vs unique

“Another month, another Power BI Desktop update” as Guy(s) in a Cube use to say.
Power BI Desktop October 2018 update brings in quite a few updates, with one thing being my favorite as I always do/check it manually when working with new data: Data Profiling. For more info and how to enable it, visit Microsoft’s official Power BI blog post or the detailed post from Matt Allington on https://exceleratorbi.com.au.

Ok, I don’t want to make it a long post, so here’s the thing: one of the Data Profiling feature is “Column distribution”.

Column Distribution allows you to get a sense for the overall distribution of values within a column in your data previews, including the count of distinct values (total number of different values found in a given column) and unique values (total number of values that only appear once in a given column).

So, distinct and/or unique. For anyone else these 2 words may seem similar, but for Data Guys like us, these are 2 different things (just like empty and null 🙂 ). Still confused? Here’s a very simple example to clear things up:

Let’s say we have a small company with 10 employees using 10 laptops from different Manufacturers: HP, Dell, Apple and Lenovo.
Manufacturers in Power BI's Column distribution
Distinct: We have laptops from 4 different Manufacturers (HP, Dell, Apple and Lenovo) aka “total number of different values”, regardless of how many of each we have.
Unique: We have only 2 laptops that nobody else have in our company (one from Apple and another one from Lenovo) aka “total number of values that only appear once”.

Thinking legacy, here’s the same thing in Excel, using countif or countifs.
Excel CountIF formula

What and when: DateAdd vs ParallelPeriod vs SamePeriodLastYear

Reza Rad over at http://radacad.com/dateadd-vs-parallelperiod-vs-sameperiodlastyear-dax-time-intelligence-question explains the differences and provides easy usage scenarios for DateAdd, ParallelPeriod and SamePeriodLastYear DAX functions.

Read his blog post to see how he reached to below conclusion:

  • DateAdd and SamePeriodLastYear both work based on the DYNAMIC period in the filter context.
  • ParallelPeriod is working STATICALLY based on the interval selected in the parameter.
  • ParallelPeriod and DateAdd can go more than one interval back and forward, while SamePeriodLastYear only goes one year back.
  • DateAdd works on the interval of DAY, as well as month, quarter and year, but ParallelPeriod only works on month, quarter, and year.
  • Depends on the filter context you may get a different result from these functions. If you get the same result in a year level context, it doesn’t mean that all these functions are the same! Look more into the detailed context.

Power BI: The key didn’t match any rows in the table

Error:

Refreshing Power BI report generates “The key didn’t match any rows in the table” error.

Cause:

Click “Edit Queries” button. If you do not see the error message, click “Refresh Preview” button. Once you have the error message, click “Go To Error“.

Error message will remain, but you should have “Edit Settings” button now, click it.

In the next screen, Navigation, you should see what exactly Power BI is trying to access but cannot do so.

In my example, I have an Excel file as my source. When I first connected to this data source, my Table name was Table1. Yesterday I changed where my Excel file gets data from and this, in turn, changed Excel’s Table name to “report“.

Obviously, when Power BI tries to refresh the data, it cannot find Table1 table anymore.

Solution:

In the same Navigation screen, selecting my new Table name “report” will fix the issue assuming all other columns in the Excel file are the same.

Same is true for any data source, not only Excel file. Follow same steps to identify what’s causing the error and then fix it as needed.

How to get and view WordPress Statistics in Power BI

Soheil Bakhshi from http://biinsight.com has a super good article on how to get your stats from a WordPress site/blog and analyze them in Power BI.

For lazy guys out there, he already built a Power BI template file that you can use straight away. The only thing you’ll need is WordPress API key but don’t worry, he explains how to get that one too!

Check it out: http://biinsight.com/analyse-your-wordpress-blog-stats-in-power-bi/.

Expressions that yield variant data-type cannot be used to define calculated columns.

Error:

Expressions that yield variant data-type cannot be used to define calculated columns.

Cause:

IF based Calculated Columns in Power BI or Power Pivot with 2 different data types is not allowed.

Solution:

Format one data type as needed using FORMAT() function.

[code language=”sql”]

Age = IF (
TableName[Birthday] < TODAY(),
FORMAT (
Year ( TODAY() )- Year ( TableName[Birthday] ),"General Number" ),
"Invalid birth date"
)

[/code]

FORMAT Function (DAX): https://msdn.microsoft.com/en-us/query-bi/dax/format-function-dax

Pre-Defined Numeric Formats for the FORMAT function: https://msdn.microsoft.com/query-bi/dax/pre-defined-numeric-formats-for-the-format-function